Qwt
Qwt is a great library. It has a lot of classes, and can be used "out of the box" to perform almost every plot related task. But more important feature is library extendability. Qwt design allow user easily implement custom classes and integrate them seamlessly with standard library.In this article I will show you how to implement custom class, derived from QwtPlotItem class (base class for all object, displayed on the plot canvas of QwtPlot), that can be used to plot very big arrays of data, with millions of points.
Plotting 101
Plotting is no more then transforming plot (or real data) coordinates to screen (widget) coordinates. One need multiply every data array point with transformation matrix and get new array with points that have coordinates in screen pixels. After that we only need to draw line segments from point to point to get plot curve on screen. In fact, this algorithm is used in QwtPlotCurve class, that allows to plot series of data.The problem is, this method is effective only when point number is not very big. When you plotting weekly sales stats over year its ok (because there are only about 50 weeks in year). But when, for example, you are trying to plot realtime data from digital oscilloscope, performance will drop drastically (because every second you will get array of data with 4M samples).
Good for us, we can use some tricks here to reduce system overheat and get good performance.
General approach to plot big arrays of data
In two words: clipping and resampling. First one is simple – we do not want waste our processor time on data that is off screen (widget) due to axis settings, or user zooming in.Second one is originates from the fact that every display has physical limitation – its resolution is fixed, and contains finite number of pixels in each dimension. So if you using Full HD display, it only has 1920 pixel on horizontal axis, that is not that much compared to 1M (or even more) points in our data array. All transformed plot coordinates (that are real numbers with floating points) will be truncated to integer, when drawing pixels on screen.
When the number of data points on screen begins to grow, there will be situation when multiple points (that have different x coordinates) will have the same x coordinate in pixels after transformation (because pixel coordinates are integer). See pictures below that illustrate this:
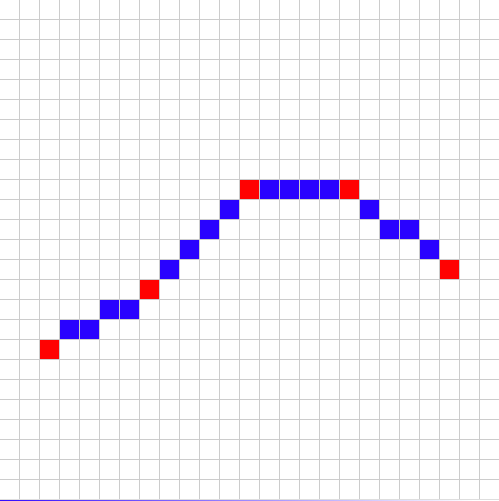 |
| Points/pixels ratio is less than 1.0: there are more horizontal pixels than points in data array |
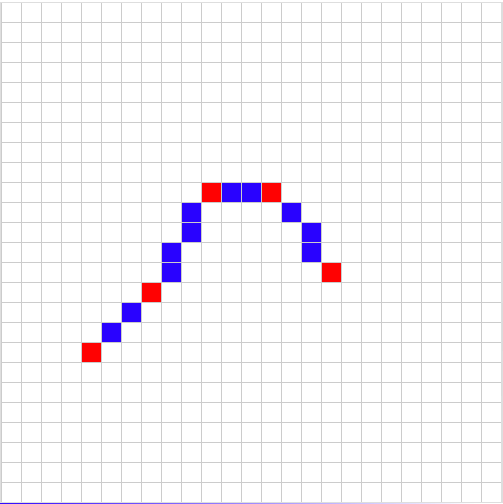 |
| Start shrinking plot by increasing points/pixels ratio. It's still less than 1.0, however. |
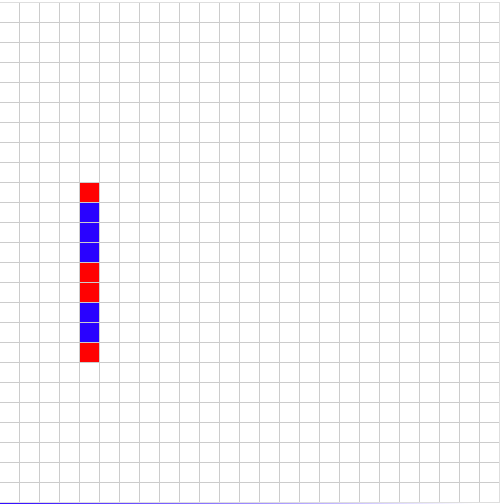 |
| Points/pixels ratio is more than 1.0: several data points correspond to the same pixel on screen |
If, for example, we are trying to fit our series data with 1M point to full screen widget, in every screen pixel there will be 1M/1920 ~ 500 points. All lines that connect these points will overdraw each other.
And we can reduce calculation/drawing time (and lag) if we replace that 500 points with only 2 - one is minimum value from array and second - maximum value, and draw only 1 line connecting these points.
To avoid drawing of indistinguishable lines on screen and improve plotting performance we need split our data array to N/P chunks, where N is number of points in data array visible on screen, and P is pixel width of canvas, that will be used to draw these points, find maximum and minimum point in array and draw only one line.
QwtArrayPlotItem class
First of all: you can download full example code from GitHub.QwtArrayPlotItem class use two overloaded methods from QwtPlotItem:
and one custom method SetData() that is used to pass array pointer to class. I don't use any "safe" container here because its more common when you work with ADC hardware to get your data in raw buffer, and just pass link to buffer is faster than copy data. Fill free to modify this as you want.
Ok, some more details now
Constructor
Just initialize internal variables and set some flags (autoscale attribute is enabled - we need return proper bounding rect for this item).
QwtArrayPlotItem::boundingRect()
Just iterate over array and found its maximum and minimum values. One trick used here: instead of simple comparing each value in array with current min/max, we form pairs of values and first compare values in pair - after that minimum value in pair is compared with global minimum, and maximum value - with global maximum. In this case we will have only 3N/2 comparisons instead of 2N.QwtArrayPlotItem::draw()
Drawing and calculating method. Depending on points we need to plot (that is determined not only array size, but user zoom and plot scales set too), method use resampling or just simple plotting. Point threshold is set as twice horizontal size of plotting canvas.By the way, memory allocation/release for pixel data array in each draw() method call is not very good solution from performance perspective, it may be better to check if we really need reallocate buffer (if number of points is equal or less than on previous call, we can use old buffer).
Screenshots of running application
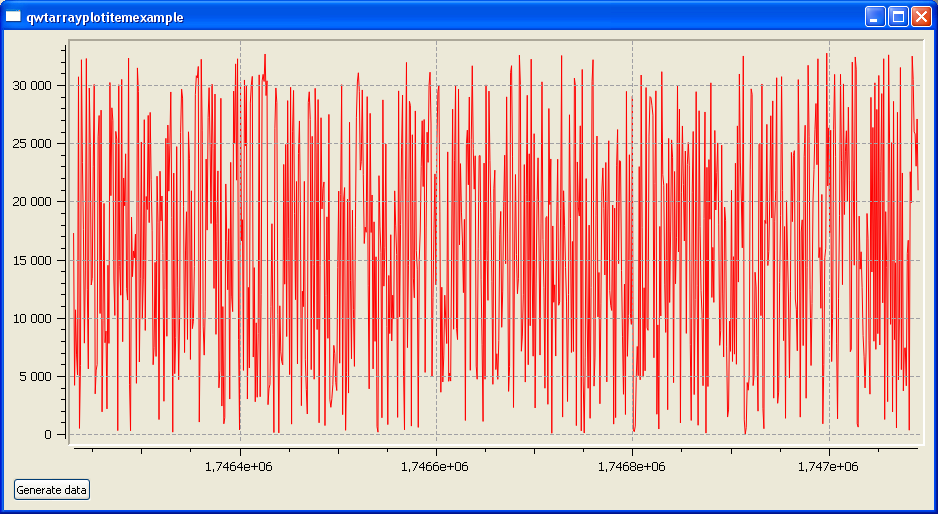
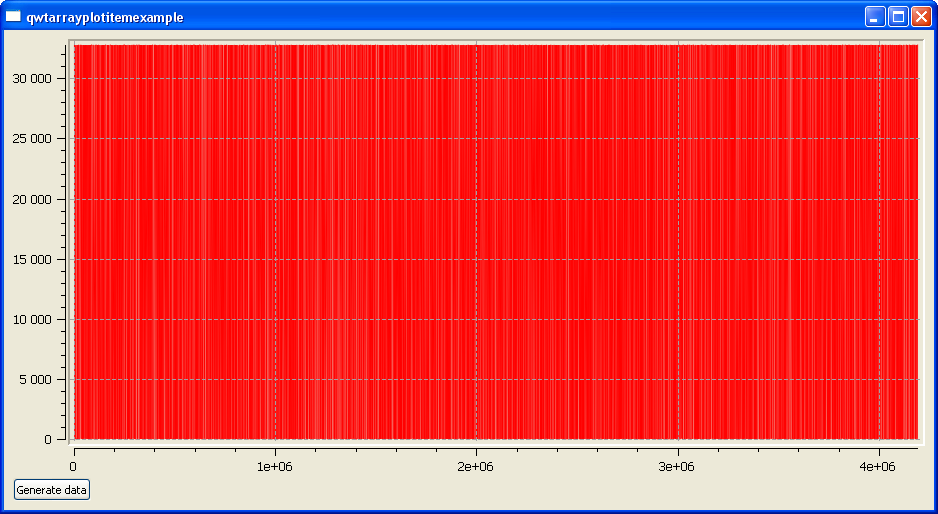 |
| 4M points filled with random numbers |
 |
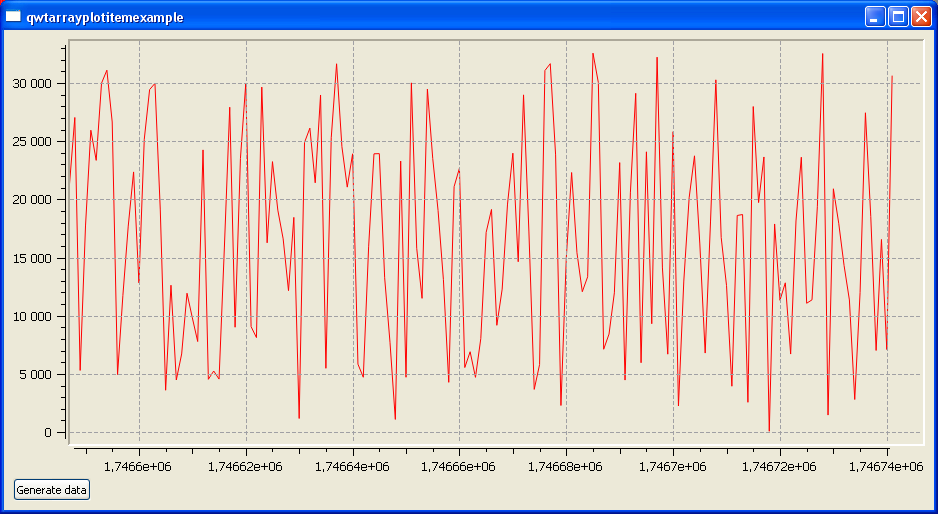
| After few zooms in |
 | |||
| And finally, we can see separate data point |
Thank you very much - very well explained. That was exactly was I was loking for.
ReplyDeleteThank you very much,I search for huge points with qwt,you teach a great deal!
ReplyDelete